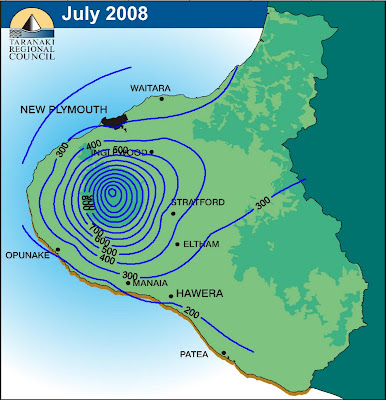
 Isohyet maps shows areas of equal rainfall via contour lines. These lines connect geographical locations who measured the same amount of precipitation. These maps may be useful in collecting and analyzing rainfall data over extended periods of time. The map above is a rainfall map of New Zealand. It depicts the rainfall for the month of July 2008. The contour lines are equivalent to 100mm of rainfall. This map was found at http://www.scoop.co.nz/stories/AK0808/S00090.htm.
 Wednesday, April 8, 2009
Isohyets
 Isohyet maps shows areas of equal rainfall via contour lines. These lines connect geographical locations who measured the same amount of precipitation. These maps may be useful in collecting and analyzing rainfall data over extended periods of time. The map above is a rainfall map of New Zealand. It depicts the rainfall for the month of July 2008. The contour lines are equivalent to 100mm of rainfall. This map was found at http://www.scoop.co.nz/stories/AK0808/S00090.htm.
Subscribe to:
Post Comments (Atom)
No comments:
Post a Comment