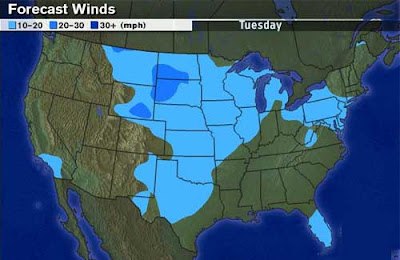
 Isoline maps are any type of contour map, or a map with lines representing equal values. Isoline maps can be used with many different types of data including pressure, population, winds, etc. These isolines are another way of presenting a third dimension. In this particular map, the isolines represent common wind speeds. This map says that there will be strong winds throughout most of the central United States. The different shades of blue depict the various wind speeds. Meteorologists use these types of maps all the time to depict the weather patterns to viewers. This map was taken from http://www.kidsgeo.com/geography-for-kids/0034-isolines.php
Sunday, April 5, 2009
Isoline Maps
 Isoline maps are any type of contour map, or a map with lines representing equal values. Isoline maps can be used with many different types of data including pressure, population, winds, etc. These isolines are another way of presenting a third dimension. In this particular map, the isolines represent common wind speeds. This map says that there will be strong winds throughout most of the central United States. The different shades of blue depict the various wind speeds. Meteorologists use these types of maps all the time to depict the weather patterns to viewers. This map was taken from http://www.kidsgeo.com/geography-for-kids/0034-isolines.php
Subscribe to:
Post Comments (Atom)
No comments:
Post a Comment