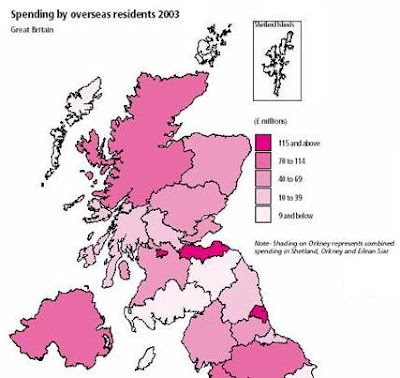
This is an example of a cholopleth map. In particular, this map is a classed univariate cholopleth map. That means that the scale is divided up in equal 5 step intervals and depicts only one variable. This map shows the average spending by overseas residents in Great Britain in 2003. The scale is in millions of pounds. The map is shaded in pink. This is a good example of a cholopeth map. It was taken from http://www.neighbourhood.statistics.gov.uk/HTMLDocs/images/BP%2520Maps6_tcm97-50746.jpe
No comments:
Post a Comment