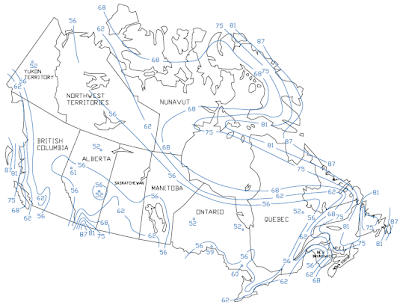
 Isotach contour lines are lines that show areas of equal wind speed. Like isobar graphs, these maps are used in depicting weather. The map shown above displays contour lines for wind speed in Canada. The numerical displays of the wind speeds are calculated hourly averages calculated at 10 meters above the ground. The map was taken from http://www.stresscrete.com/technical-resources/wind-maps/canadian-isotach-wind-map.asp.
Wednesday, April 8, 2009
Isotachs
 Isotach contour lines are lines that show areas of equal wind speed. Like isobar graphs, these maps are used in depicting weather. The map shown above displays contour lines for wind speed in Canada. The numerical displays of the wind speeds are calculated hourly averages calculated at 10 meters above the ground. The map was taken from http://www.stresscrete.com/technical-resources/wind-maps/canadian-isotach-wind-map.asp.
Subscribe to:
Post Comments (Atom)
No comments:
Post a Comment