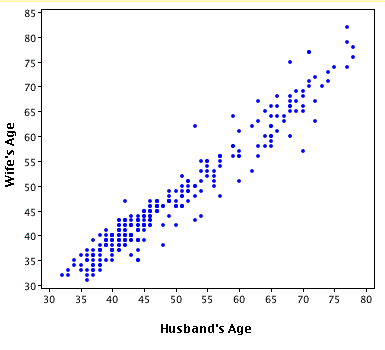
 A scatterplot is an plot that shows the relationship or trend between two types of data. The values, or observations, are presented as dots, and after enough have been plotted, a trend line is added in order to determine the best relationship between the two. This particular scatterplot depicts the trend in a husband's age to a wife's age in order to determine if there is a relationship between the two. For the most part, the trend shows that an increase in a husband's age will also cause an increase in a wife's age. However, there are definitely outliers and data that varies from that trend. This plot was taken from http://cnx.org/content/m10950/latest/age_scatterplot.gif
Wednesday, April 15, 2009
Scatterplot
 A scatterplot is an plot that shows the relationship or trend between two types of data. The values, or observations, are presented as dots, and after enough have been plotted, a trend line is added in order to determine the best relationship between the two. This particular scatterplot depicts the trend in a husband's age to a wife's age in order to determine if there is a relationship between the two. For the most part, the trend shows that an increase in a husband's age will also cause an increase in a wife's age. However, there are definitely outliers and data that varies from that trend. This plot was taken from http://cnx.org/content/m10950/latest/age_scatterplot.gif
Subscribe to:
Post Comments (Atom)
No comments:
Post a Comment