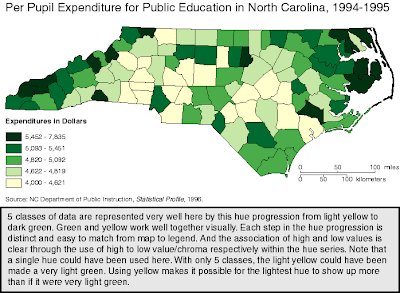
 Choropleth Maps present various types of statistical data or areal data. A classed choropleth map is a particular type of choropleth map that uses smaller intervals to portray the data. It is broken down into a scale and presented using colored intervals. This particular map has 5 classification internals. The colors used to display that data are from light yellow to dark green. This map is an standardized map as well since it presents the data per student. This map depicts the amount in dollars spent per student in the Public Education System in North Carolina. The statistics are for the 1994-1995 school year. This map was taken from http://personal.uncc.edu/lagaro/cwg/color/Choropleth-5Good.gif.
Monday, April 13, 2009
Classed Choropleth Maps
 Choropleth Maps present various types of statistical data or areal data. A classed choropleth map is a particular type of choropleth map that uses smaller intervals to portray the data. It is broken down into a scale and presented using colored intervals. This particular map has 5 classification internals. The colors used to display that data are from light yellow to dark green. This map is an standardized map as well since it presents the data per student. This map depicts the amount in dollars spent per student in the Public Education System in North Carolina. The statistics are for the 1994-1995 school year. This map was taken from http://personal.uncc.edu/lagaro/cwg/color/Choropleth-5Good.gif.
Subscribe to:
Post Comments (Atom)
No comments:
Post a Comment