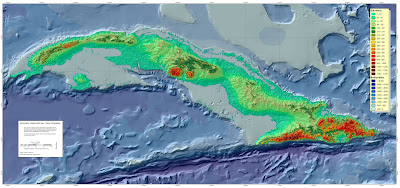
 Hypsometric maps are surface maps that depict relief or elevation. This can be shown via color, contour lines, or raised relief. This particular map uses color to show elevation in a Cuban Archipelago. The scale is 1: 1,000,000. It shows elevation from 1 to 1970 and bathymetry from 0 to >>-6000. The shading gives a three dimensional view, which helps to portray the elevation depicted on the map. This map was taken from http://igitur-archive.library.uu.nl/dissertations/2008-1010-200655/Annex4A.jpg
Friday, April 3, 2009
Hypsometric Maps
 Hypsometric maps are surface maps that depict relief or elevation. This can be shown via color, contour lines, or raised relief. This particular map uses color to show elevation in a Cuban Archipelago. The scale is 1: 1,000,000. It shows elevation from 1 to 1970 and bathymetry from 0 to >>-6000. The shading gives a three dimensional view, which helps to portray the elevation depicted on the map. This map was taken from http://igitur-archive.library.uu.nl/dissertations/2008-1010-200655/Annex4A.jpg
Subscribe to:
Post Comments (Atom)
No comments:
Post a Comment