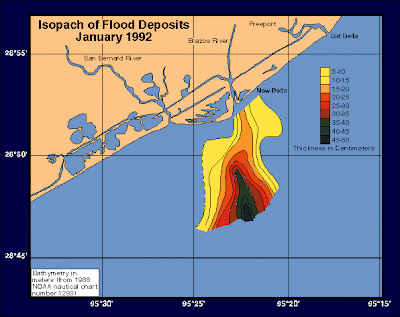
Isopach maps show thickness of rock beds or sediment deposits. They may be convent for engineers attempting to reach the local water tables or for scientists looking for the best place to drill for oil. This particular map above shows the thickness of sediment deposits from flood. The map uses colors to distinguish more easily between the different levels. The thickness of the deposits is measured in centimeters. This flooding happened along the Brazos River in Texas. These measurements were taken in January of 1993. This map was taken from http://gulf.rice.edu/modBdel.html.
No comments:
Post a Comment