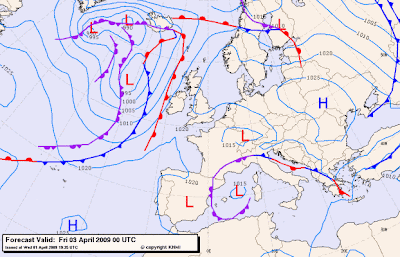
 Isobar lines are a type of contour lines. These lines show areas of equal air or atmospheric pressure. This is a common type of graph used to depict weather conditions. This particular graph shows a forecast for Friday April 3, 2009. The different colored lines show areas of different pressures. The forecast is for a small portion of the Eastern Hemisphere, mostly Europe.
This map was taken from http://www.windfinder.com/weather/. However, the link will always displace the most current forecast.
No comments:
Post a Comment