
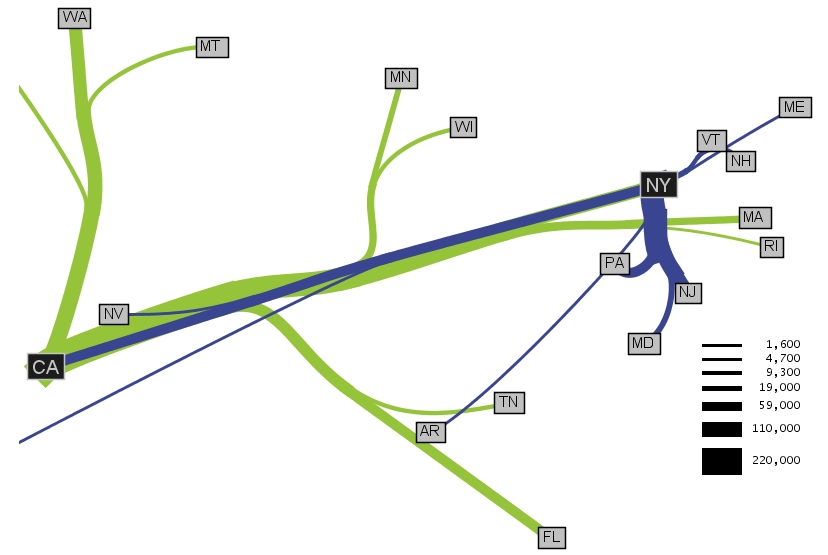
Flow maps are used to show actual paths and intensities across a surface/land mass. Specifically, they can be used to show locations of travel, like this particular map. If they show paths of travel, they will only represent general direction, not actual paths. This particular map shows the top 10 states that migrate to New York and California. It does not show the paths, but rather general directions. The intensity of the migration, or the number of people moving, is given by the thickness of the lines. The scale is shown on the bottom right of the map. The green lines show migration to California, and the purple lines show migration to New York City.
This map was taken from http://graphics.stanford.edu/papers/flow_map_layout/ca-ny-web.jpg.
No comments:
Post a Comment