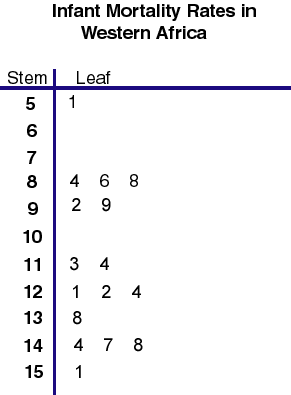
 Stem and leaf plots are a way of presenting numerical data. The data found on the left hand side of the solid line is considered the stem, and the numbers on the right are the leaves. This particular stem and leaf plot depicts infant mortality rates in Western Africa. The rates range from 51 to 151. This stem and leaf plot was taken from http://mainland.cctt.org/mathsummer/JosephBond/StemAndPlots/images/table2.gif
Tuesday, April 21, 2009
Stem and Leaf Plot
 Stem and leaf plots are a way of presenting numerical data. The data found on the left hand side of the solid line is considered the stem, and the numbers on the right are the leaves. This particular stem and leaf plot depicts infant mortality rates in Western Africa. The rates range from 51 to 151. This stem and leaf plot was taken from http://mainland.cctt.org/mathsummer/JosephBond/StemAndPlots/images/table2.gif
Subscribe to:
Post Comments (Atom)
No comments:
Post a Comment