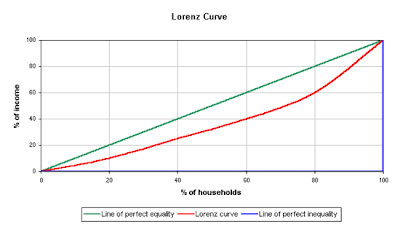
 A Lorenz curve is used to display probability distribution. The straight line shows the values if X and Y were proportional, and the curve shows actually distribution that is not equal. This particular Lorenz curve shows the relationship between the percentage of households verses the percentage of income. For example, it states that 60% of income is concentrated in 80% of households, meaning that the income is not distributed equally. This map was taken from http://en.wikipedia.org/wiki/Lorenz_curve.
 Wednesday, April 15, 2009
Lorenz Curve
 A Lorenz curve is used to display probability distribution. The straight line shows the values if X and Y were proportional, and the curve shows actually distribution that is not equal. This particular Lorenz curve shows the relationship between the percentage of households verses the percentage of income. For example, it states that 60% of income is concentrated in 80% of households, meaning that the income is not distributed equally. This map was taken from http://en.wikipedia.org/wiki/Lorenz_curve.
Subscribe to:
Post Comments (Atom)
No comments:
Post a Comment