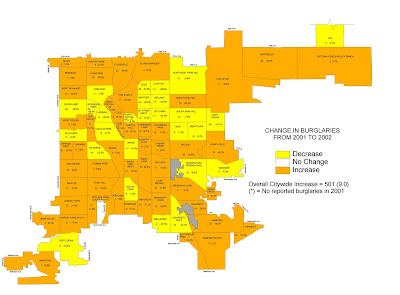
Statistical maps are based upon numerical values. The given map depicts statistical changes in burglaries in the Denver, Colorado, area. The yellow areas indicate a decrease in crime from 2001 to 2002; the orange areas show an increase; and the white areas stayed the same. Also, if you zoom in, texts superimposed on the divisions show the percentage increase and the percentage decrease. Overall, there was an increase in burglaries in the city of Denver from 2001 to 2002, and that is depicted through a statistical map.
It was taken from http://www.denvergov.org/Portals/335/images/SOPA_bur02.jpg
No comments:
Post a Comment