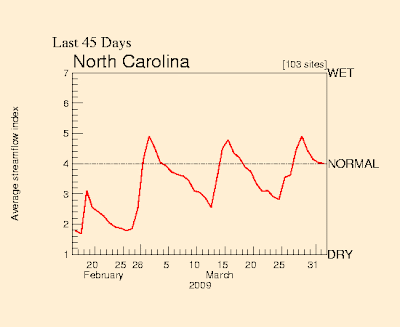
 In an index value plot, an index value is plotted instead of an actually number. This type of plot gives a comparison, or normal, in order to base the values off of. In this particular visualization, the average stream flow index is plotted based upon particular days of the week. The number value of comparison is 4. This data was collected in North Carolina and ranged from mid February to the end of March. This plot was taken from http://water.usgs.gov/waterwatch/?m=real&r=nc&w=real%2Cplot.
 Wednesday, April 15, 2009
Index Value Plot
 In an index value plot, an index value is plotted instead of an actually number. This type of plot gives a comparison, or normal, in order to base the values off of. In this particular visualization, the average stream flow index is plotted based upon particular days of the week. The number value of comparison is 4. This data was collected in North Carolina and ranged from mid February to the end of March. This plot was taken from http://water.usgs.gov/waterwatch/?m=real&r=nc&w=real%2Cplot.
Subscribe to:
Post Comments (Atom)
No comments:
Post a Comment