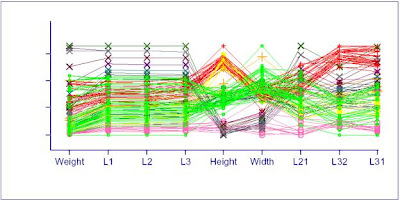
Parallel coordinate graphs display multiple data on one graph. Each variable is plotted on a vertical axis. In particular, parallel coordinate graphs can be used to compare data of different variables. This particular graph shows the relationship between weight, L1, L2, L3, Height, Width, L21, L32, and L31. This graph was found at http://www.evl.uic.edu/aej/526/kyoung/Training-parallelcoordinate.html.
It allow the easy visualization of experimental data.These plots gives us a good and direct conclusion of the experimental data.
ReplyDeleteBox and Whisker Plots